How to Use the Math Graphing Tool Desmos
Plotting Points
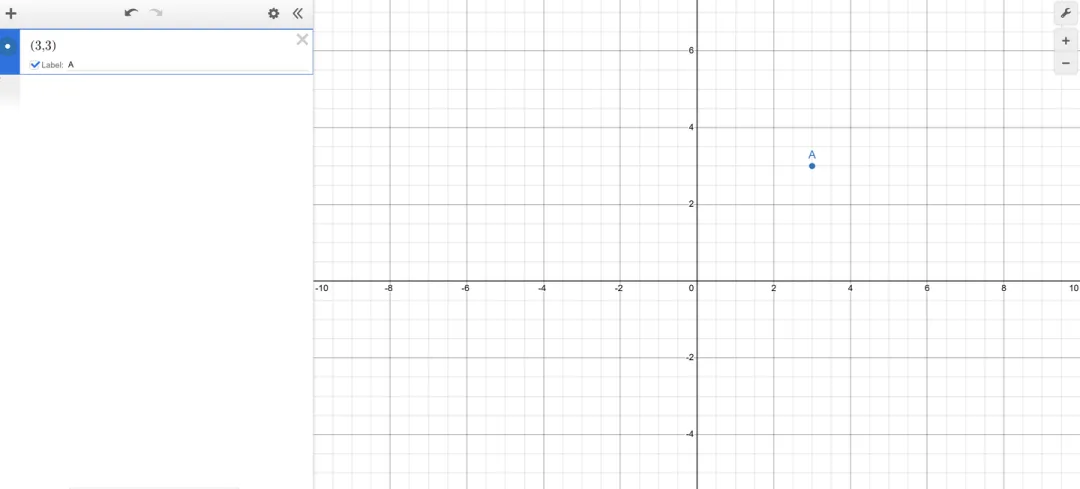
After opening the graphing calculator, you will see the expression list on the left and the grid on the right. In the expression list, you can input coordinates, expressions, equations, and more. Try entering a point, such as (3,3), and you can also label this point as A.
Plotting Lines and Curves
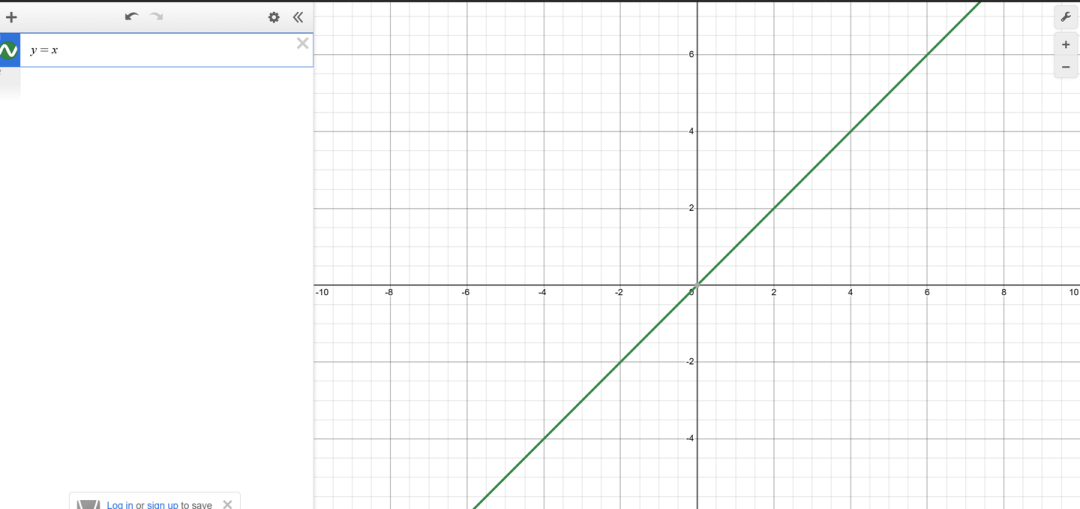
Use y=x to plot the simplest straight line.
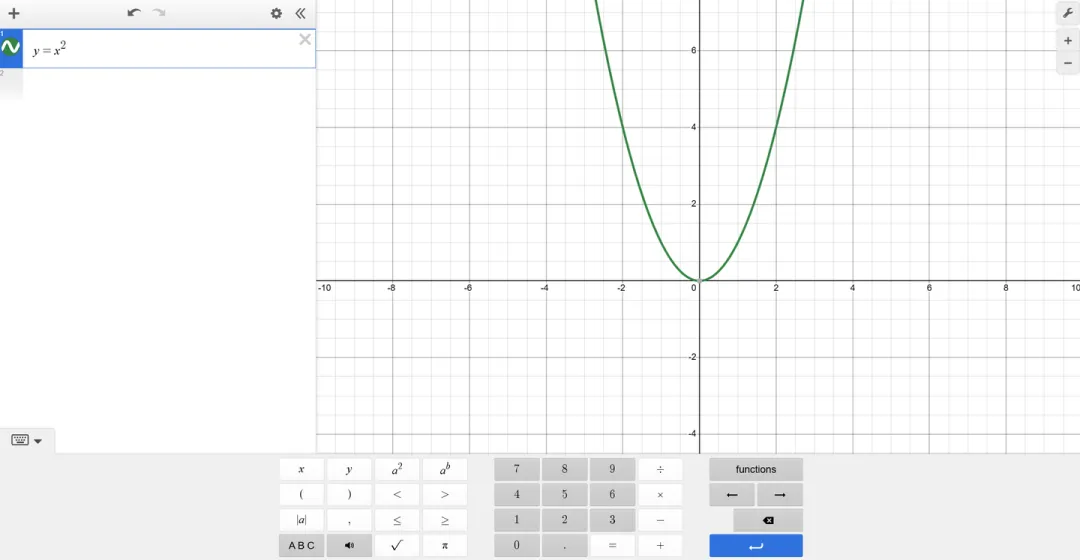
Use y=x^2 to plot the simplest curve. To input the squared term, click the small keyboard icon at the bottom left, then press the button labeled a². Alternatively, you can click the button a^b; the cursor will then focus on the exponent position where you can enter any value.
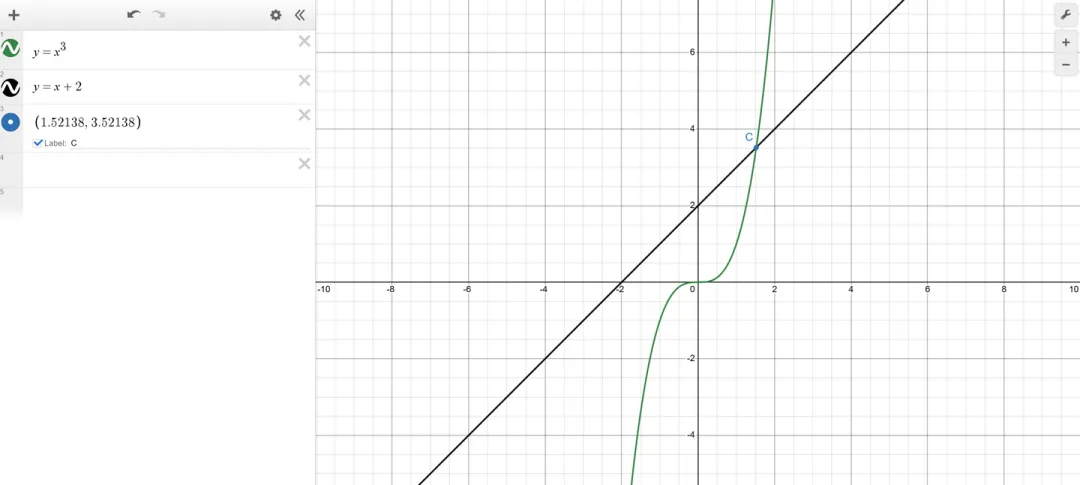
Marking Intersection Points
When two function graphs intersect (either graph-to-graph or graph-to-axis), Desmos marks these intersection points with gray dots. To emphasize any of these points, click on the gray dot to display its coordinates. Next to the coordinates, there is an icon with an arrow—clicking this icon will add the point to the expression list on the right, allowing you to label it, for example, as C.
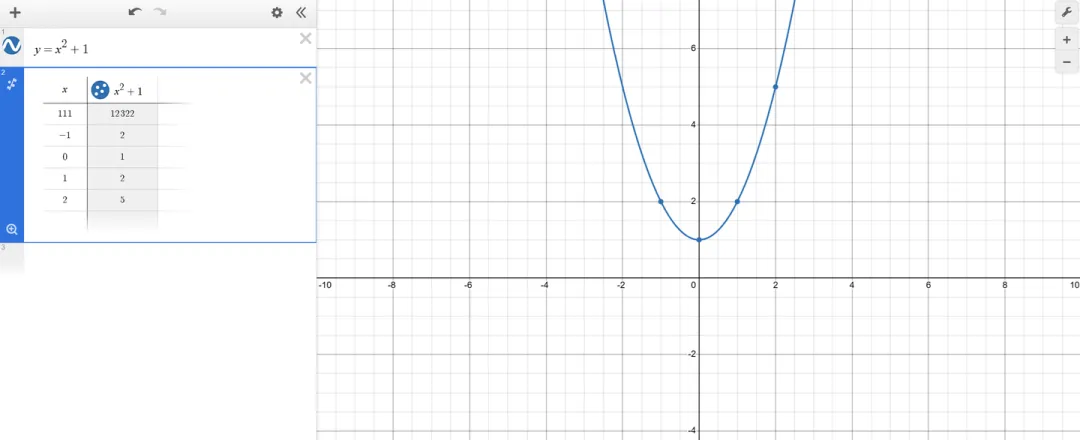
Function Evaluation
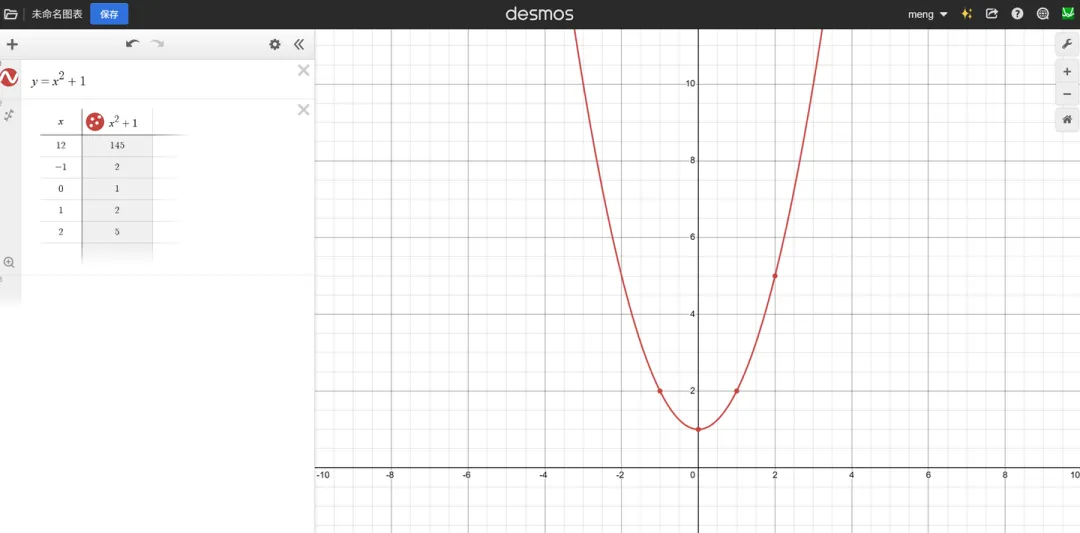
After entering any function expression, click the settings button to the upper right of the expression (the second to last icon on the upper right; the first icon hides the entire expression bar). Clicking settings will reveal three small icons to the right of the expression: the first to create a table, the second to duplicate the current expression, and the third to delete it.
Click the first icon to create a table. A 7-row by 2-column table will appear, where the first column represents the x-values and the second column shows the corresponding y-values. The values in the table are system-generated defaults. You can modify the x-values, and the y-values will update in real time, effectively giving you the function’s values. Each point in the table will also be marked on the graph to the right, and you can individually label these points if desired.
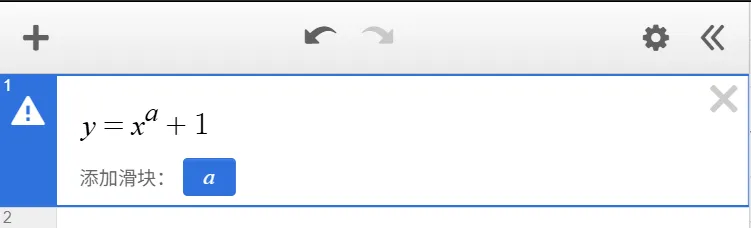
Adding Constants
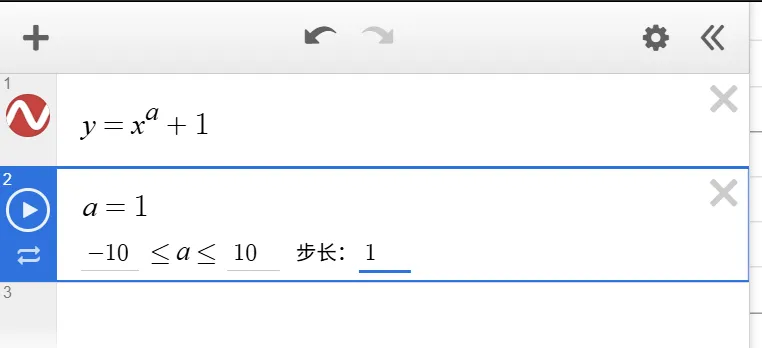
Constants in function expressions are usually represented by lowercase letters; for example, entering an exponent as a will immediately prompt an option to add a slider for “a.”
Clicking this button adds a new expression below to define the constant’s value range, which by default is from -10 to 10. Both -10 and 10 can be individually adjusted.
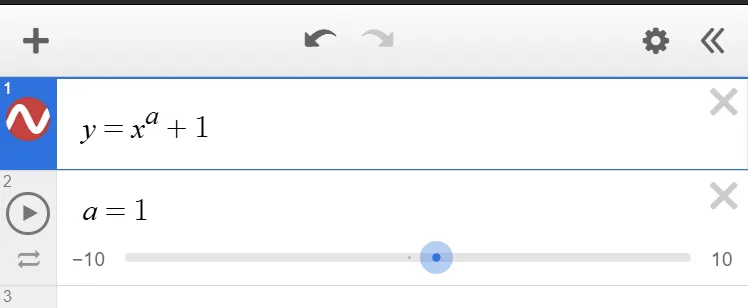
Clicking on the 10 or -10 values will allow you to modify these bounds as shown below. The inequality on the left sets the minimum value for constant a, and the one on the right sets its maximum. The step size specifies how much a changes per second during animation. Once configured, press the play button next to the expression to immediately see the function animate on the graph to the right.
Saving Your Graph and Sharing with Classmates and Friends
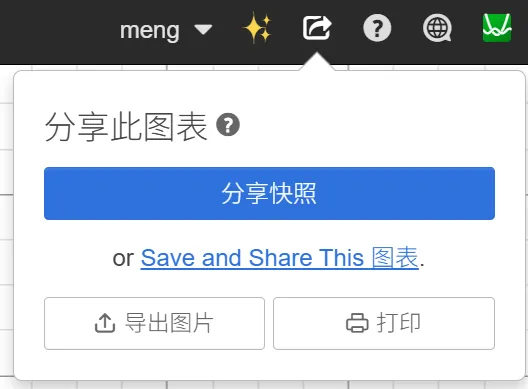
To save your current graph, you need to register as a Desmos user. Registration requires an email account; after entering your name and a custom password, registration is complete (no email verification or payment required). After logging in, click the share button at the top right of the graph (the icon with an arrow pointing right).
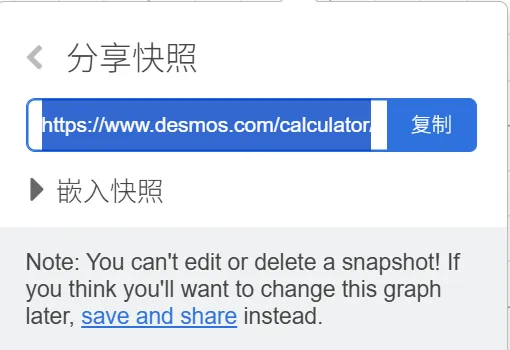
Clicking the share button opens a small popup. Select “Share Snapshot” to instantly generate a complete URL for your graph. This URL can be opened on any computer or mobile browser to access your graph. You can also choose to print the graph or save it as an image.
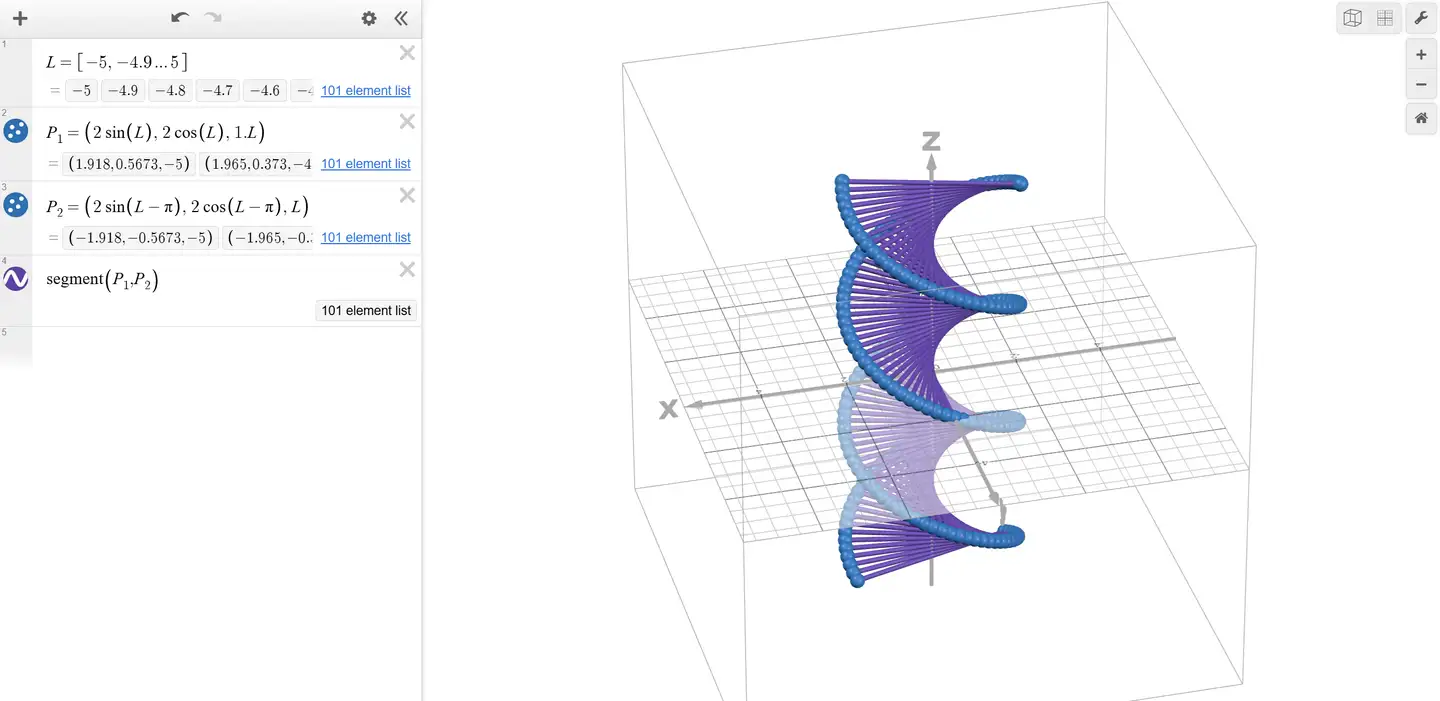
The above covers the most basic operations. Desmos is capable of much more complex graphs. For example, here is a slightly more advanced demonstration using four function expressions to create a double helix: www.desmos.com/3d/d032e2f881.
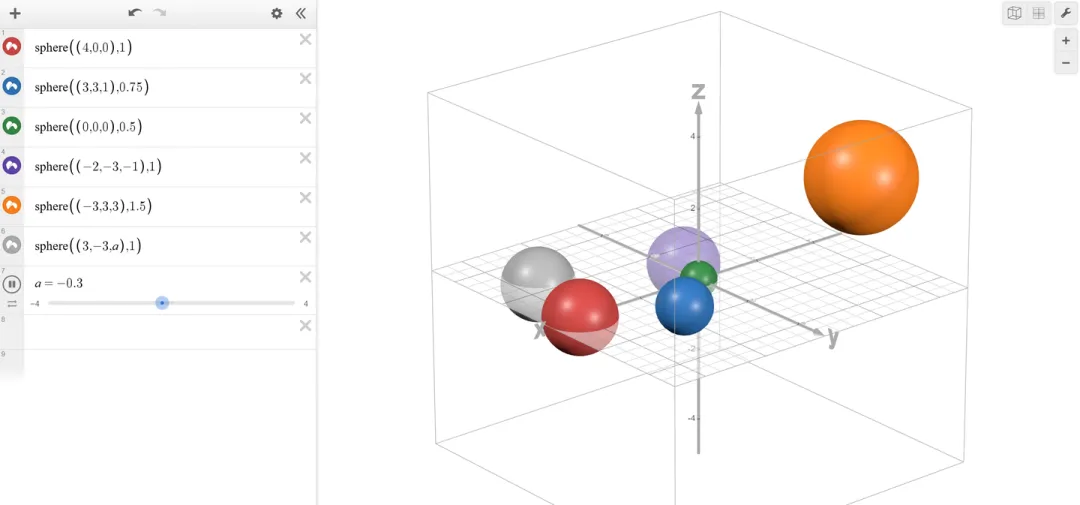
Use the sphere function provided by Desmos to create a 3D sphere.
Additionally, Desmos supports animation, which is quite straightforward—by manipulating the range of constants, you can animate your graphs. See the 3D bifurcation example here: https://www.desmos.com/3d/51a4237846
Website URL: how-to-use-desmos